

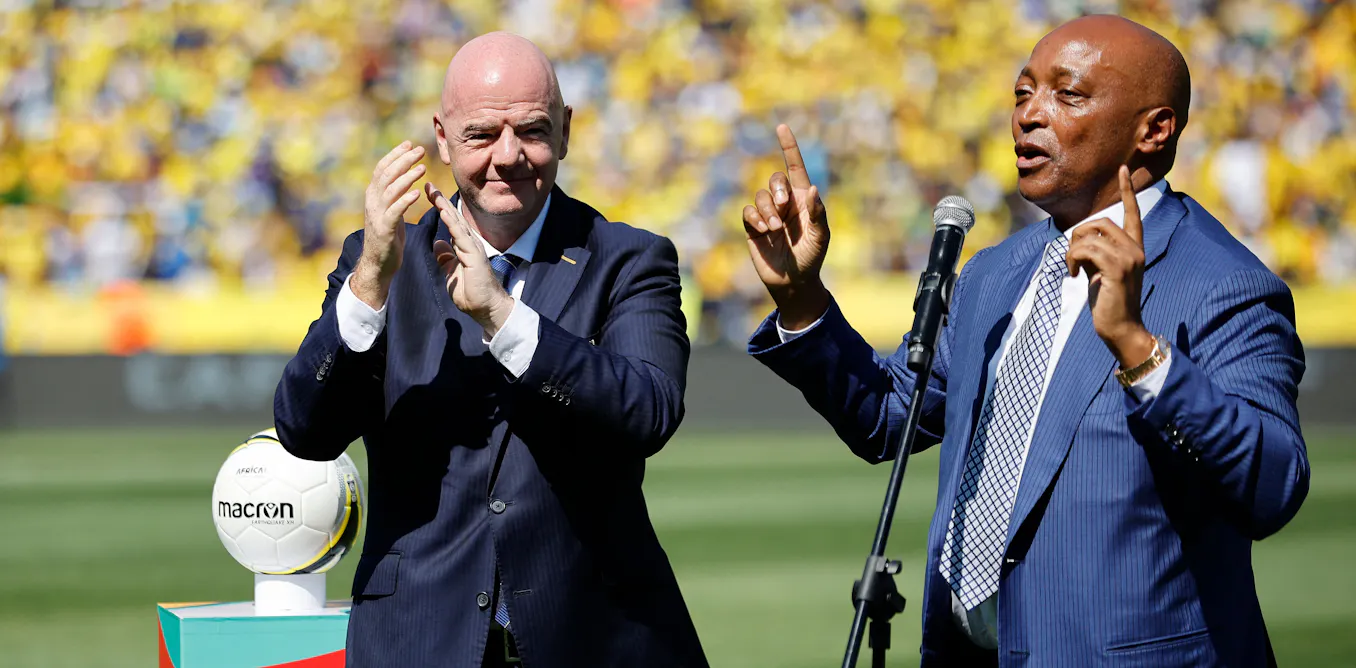
Gianni Infantino might have backed down from his proposal to sell a minority stake of Fifa to corporate investors and he may be facing a backlash from all sides, but the steady commercialisation of the game continues.
Gerard A. Akindes studies the political economy of African football. His work traces how capital, corporate interests and broadcasting networks influence the sport in a globalised world. We asked him some questions.
What role does Fifa play in African football?
Fifa is the global governing body for football. Its main job is to set and enforce the rules of the game, organise major international tournaments like the World Cups, and oversee the sport’s development. To do this, it works through six continental confederations, one of which is Caf in Africa.
Caf implements global standards and manages Africa-wide and regional national and club competitions. Most of its revenue is generated by running the Africa Cup of Nations tournament and from financial support from Fifa.
Fifa’s role is complicated. It provides critical developmental aid, but this makes African football economically dependent on it. As I will explain, this can also fuel African institutional dysfunction.
Schools were traditionally the primary breeding ground for young African athletes after independence. But decades of government disinvestment, accelerated by 1990s World Bank and International Monetary Fund adjustment programmes that cut school sport, severely impeded football’s developmental capacity.
Private African football academies partially filled the void. But they function mainly as export-oriented pipelines, draining talent from the continent. Meanwhile, satellite broadcasts of European leagues captured local fans and diverted attention from homegrown football.
In this fragile ecosystem, Fifa became a critical support for national football associations. The association’s president Gianni Infantino transformed his predecessor Sepp Blatter’s Goal Programme into the Fifa Forward Development Programme. He substantially increased subsidies. In 2025, he confirmed the programme had injected over US$1 billion into African football since its establishment in 2016.
The weight of Fifa funding relative to a federation’s total budget depends on the level of local government subsidies and other revenuehe national federation’s budget
These subsidies have introduced governance distortions. Reports in Nigerian and Congolese newspapers, for example, have documented financial irregularities concerning Fifa Forward funds. This points to significant transparency challenges in their administration.
There has been a growing dependency on Fifa and, with it, the erosion of political autonomy. African football association presidents and Caf’s president have proved unable to push back against Fifa. This is evident in their unanimous support for Infantino’s re-election in March 2027 and their silence on 2026 World Cup immigration abuses. They failed to voice concern over the controversial World Cup investment plan.
The pattern extends to Caf itself. Infantino influenced the confederation’s leadership transitions in 2017 and 2021, effectively hand-picking its current president, Patrice Motsepe.
The effectiveness of Fifa funds depends on how they are managed by national football federations. Without complementary investments in governance integrity and competence, accountability, domestic league and club infrastructure, and Caf’s strategic independence, this funding risks entrenching dependency rather than fostering sustainable self-sufficiency.
Do Fifa’s subsidies actually boost development?
Ultimately, Fifa’s funding does not serve grassroots football. It appears instead to have reinforced Fifa-aligned administrative structures that prioritise the interests of the elite national game, its infrastructure and its tournament prize money. The dynamic suggests Fifa is more concerned with the professional game, where political returns and global branding are stronger than the grassroots football that forms the sport’s foundation across the continent.
Fifa’s talent development programme intends to establish 20 to 30 football academies across Africa by 2027, but also reveals structural disconnects. There has already been a mushrooming of unregulated academies in Côte d’Ivoire, Senegal, Nigeria, and elsewhere. Additional Fifa-funded academies raise critical questions.
As they train young players, will they also address the shortage of well-trained youth coaches? Will they integrate into domestic league structures to strengthen local competitions? Will they support regular, organised national youth tournaments? It’s still too early to assess their impact. The first two academies, in Mauritania and Djibouti, only started operating in 2025.
Similarly, Infantino’s Football for Schools programme, launched in 2019 and active in 46 African countries, operates alongside already weakened school sport ecosystems. It aims to use football to teach life skills, not to boost the quality of school football education.
Concentrating financial support on highly visible elite programmes, while neglecting deeper structural and capacity challenges, perpetuates a donor-recipient aid model. It benefits a narrow segment of the football ecosystem.
The introduction of new elite competitions like the forthcoming Nations League won’t necessarily reinforce the quality of the existing school sports.
Good governance, structural organisation, and capacity building in African football must be the responsibility of African governments and football associations. Fifa should provide support where needed, rather than these being Fifa-driven projects endorsed by governments. Fifa’s role should be to plug into national football development visions, strategies and plans, not the other way around.
What is the impact of lucrative broadcasting rights?
Since pay-TV took hold in Africa, starting in the 1980s, viewing has steadily shifted to subscription models. For African football viewers, this shift began in earnest in 2006 when Arab Radio and Television acquired Algerian broadcasting rights, forcing decoder purchases.
Under Blatter, an agreement with the African Union of Broadcasting kept Fifa tournaments free-to-air. That expired after the 2014 World Cup. Infantino’s Fifa fully privatised rights, selling them to private broadcasters.
In sub-Saharan Africa, New World TV currently holds exclusive World Cup rights. To prevent total paywall exclusion, roughly half the matches are sub-licensed to public service broadcasters. This guarantees some free access, but most countries in the region still face the world’s highest data costs and decoder fees. For most fans with no pay-TV subscription, collective viewing in bars and public viewing spaces or reliance on pirate streams remain the only accessible options.
When the continent’s most passionate supporters must navigate pay-TV, costly data and unreliable streams just to follow their teams at the World Cup, Fifa’s record revenues appear less a sign of progress and more a betrayal of football as the “people’s game”.
Could African nations help keep Infantino in office?
Since João Havelange, Fifa president from 1974 to 1998, Africa has been a crucial voting bloc. A candidate needs 106 votes out of the 211 total member associations, provided there are only one or two candidates on the final ballot.
Fifa presidents may serve three four-year terms. Infantino stepped in for three years of Blatter’s term, so has been president for a decade. He may run for one more term.
Infantino plays the same game as Blatter. He distributes rean countries helped him win in 2016 based on promises to double development funding. It’s a promise he’s kept
But the reality is complex. Significant benefits come with deep structural costs.
On the positive side, Fifa under Infantino has substantially increased development funding; expanded World Cup slots for Africa from five to nine in 2026; and provided critical COVID-19 relief.
On the negative side, his agenda proceeds with little meaningful critical debate from African leadership. Reforms are accepted without critical discussion, even when they’re ill-suited to Africa’s distinct football ecosystem – such as Afcon being held every four years instead of two, or the abandoned African Super League.
Financial dependency explains why African nations consistently vote for Infantino. African football administrators have already signalled support for his re-election, and Africa’s 54 votes are strategically critical.
While Infantino’s revenue-driven priorities may not align with African realities, ultimate responsibility rests with African football associations and leaders. They are the continent’s experts and must defend what works for their fans and communities.
The pressing question is whether they can claim the autonomy and integrity to prioritise African football and not Fifa’s global agenda, while remaining truly accountable to the young players and supporters for whom the game must always be “the people’s game”.

