

Abstract
Tropical croplands sit on strongly weathered soils where soil functions and ecosystem services such as carbon storage are constrained by texture, mineralogy, climate, and pedogenesis, making direct comparison with temperate-derived soil health benchmarks unreliable. Here we develop a region-specific soil health assessment protocol and evaluation for Sub-Saharan Africa that benchmarks soil health indicators (e.g., organic carbon) against their ecological context rather than fixed concentration thresholds. We used soil organic carbon to illustrate the tool application. Using 28,000 georeferenced topsoil samples from Ethiopia, we combine soil, climate, vegetation, and terrain covariates in a hierarchical Bayesian model that estimates context-specific soil organic carbon distributions and uncertainty. The framework converts measured soil health indicators (organic carbon) into percentile scores and opportunity gaps, quantifying how far a soil sits from the upper range of similar soils under comparable climate. Results show that soil texture, mineralogy, and temperature primarily set the attainable soil organic carbon ceiling; management determines how closely individual fields approach it. The framework provides field-scale targets for realistic soil health gains across tropical agricultural landscapes.
Subjects
- Environmental impact
- Plant sciences
Introduction
Soils are the planet’s largest active reservoir of terrestrial carbon1,2. They regulate water and nutrient cycling and provide more than 95% of global food production, a demand projected to rise by 50% by 2050 as the population expands3,4. But the ability of soils to perform these functions is being depleted faster than it can be restored5,6. For decades, soil assessment focused on soil quality, emphasizing short-term productivity and chemical fertility7. That approach improved agronomic yields but overlooked the biological activities that sustain resilience. The shift to soil health has growing recognition, reframing soils as dynamic and living systems defined as “the continued capacity of soil to function as a vital living ecosystem that sustains plants, animals, and humans,” integrating soil biological, chemical, and physical properties8,9,10. Despite this shift, many assessment frameworks still use a uniform relationship among indicators across inherently different soils. On top of that, most remain anchored in temperate benchmarks and overlook the ecological diversity, pedogenic, and climatic constraints that define tropical agroecosystems11,12,13. Therefore, assessment must go beyond combining biological, chemical, and physical indicators but also interpret them within their inherent and functional context13,14,15. This recognition motivates the development of the soil health assessment protocol and evaluation for Sub-Saharan Africa (SHAPE-SSA), a framework that quantifies soil health relative to each soil’s ecological potential and associated uncertainty, connecting assessment directly to sustainable land management decisions.
The urgency of this issue is evident in the tropical soils of Sub-Saharan Africa (SSA), where food demand (e.g., cereal crops) is expected to double by 205016. To become self-sufficient in cereals, yields would need to increase from their current 2.0–5.8 t ha−1 yr−1 17. This is more complicated with most of the farming on rainfed and nutrient-poor tropical soils. These soils are some of the oldest, most weathered, depleted in nutrients, and erosion-prone18. Low fertility constrains not only crop productivity, but also nutrient content in staple cereals, associating soil degradation directly with malnutrition at large19,20. Within this challenge, the emerging concept of soil security emphasizes the need to safeguard soil condition, capability, and resilience to sustain both food production and long-term ecosystem function21. In this context, soil health in SSA is not only an agronomic concern but also it is a determinant factor for nutritional outcomes, environmental stability, and livelihoods. By linking soil health to plant health, food quality, and human well‑being, soil security provides a direct bridge between food security and the broader One Health framework, making soils a foundational pathway for sustainable development across SSA22.
Soil health assessment is complex because the functions that sustain productivity and ecosystem services cannot be measured directly14. Instead, assessment relies on indicators that reflect different components of the soil system13. Physical properties such as bulk density and aggregate stability capture soil structure and water dynamics; chemical properties such as pH and cation exchange capacity regulate nutrient supply; and biological properties such as microbial activity indicate organic matter turnover15. Each provides useful but partial information9,15. However, their sensitivity to changes in soil type, climate, and management is different. In most cases, high nutrient concentrations may suggest good chemical fertility, but long-term ecosystem service depends on active soil biology. Without active microbes and physical properties such as stable aggregates, adequate porosity, and good infiltration, soil cannot effectively deliver services like nutrient cycling, water regulation, or carbon sequestration20,21. Such heterogeneity emphasizes the need for integrative context-aware frameworks that interpret multiple indicators relative to both inherent and dynamic soil properties that separate natural constraints from management effects23.
A central limitation of most existing soil health frameworks lies in their reference base for scoring: thresholds are derived by aggregating values across all soils in the calibration dataset and then applied uniformly to pedologically distinct soils, rather than comparing each soil to its inherent capacity and condition. This issue becomes especially important in tropical landscapes because many calibration datasets are dominated by temperate agroecosystems with younger, less-weathered soils. As a result, thresholds derived from these aggregated reference distributions may transfer poorly to highly weathered soils (e.g., found in the tropics), where mineralogy, climate, and pedogenic history produce different baseline behavior. For instance, the Soil Management Assessment Framework (SMAF24) and the Comprehensive Assessment of Soil Health (CASH25) integrate multiple indicators, but use scoring functions and thresholds derived from temperate soils. In tropical systems, naturally low soil organic carbon (SOC) concentrations and rapid turnover can cause monotonic “more-is-better” scoring curves to misinterpret inherent soil conditions as degradation26. SMAF, for example, may classify Ferralsols as low in organic matter even when their carbon content reflects long-term mineralogical stability27. Similarly, Andosols and other soils rich in poorly crystalline minerals tend to accumulate carbon through strong mineral-organic associations, and monotonic scoring can overestimate their performance28. CASH thresholds show similar limitations because observations are aggregated into broad reference distributions, so the resulting benchmarks do not transfer well to environments where climate, mineralogy, and management history shape different response ranges and nonlinear soil responses25,29.
These limitations are also recognized in the soil security literature, which distinguishes inherent soil diversity (genosoils) from condition-dependent states (phenosoils) and uses pedogenon-based classification to describe soil capability and how it changes across landscapes30,31. This view supports the need for assessment frameworks that compare each soil to its inherent capacity rather than applying the same thresholds to all soils. The reliance of these frameworks on monotonic scoring curves built on assumed normal distributions and fixed thresholds neglects the reality that many soil health indicators respond non-linearly, may plateau (or even in some cases decline) beyond certain levels, and are strongly influenced by soil type, climate, and management history32. The soil health assessment protocol and evaluation (SHAPE13) implements this concept by incorporating pedogenic and environmental context into benchmarking and scoring26. Although SHAPE integrates soil type and climate covariates, its United States-centric calibration limits its applicability in highly weathered soils of tropical regions, reinforcing the need for region-specific, uncertainty-aware benchmarking approaches that distinguish inherent soil genotype from management-responsive potential14,23,33.
Here, we present the soil health assessment protocol and evaluation framework developed for Sub-Saharan Africa (SHAPE-SSA). The framework combines inherent soil properties, climate covariates, and management-responsive indicators within a hierarchical modeling approach that quantifies uncertainty and produces peer group scoring interpretation suited to the tropical environment. In this first application, we focus on SOC, a key indicator of soil health that reflects both inherent soil potential and management effects using about 28,000 geo-referenced samples. Although SOC is used as a test case, SHAPE-SSA is designed to advance into a broader, multi-indicator framework that includes biological, chemical, and physical indicators of soil function. Our objectives are to (i) develop and introduce the SHAPE-SSA framework and demonstrate its adaptability to tropical datasets; (ii) identify the key soil and climatic factors determining SOC variability; and (iii) illustrate how percentile-based peer group scores can guide farmers, extension agents, and policymakers to interpret soil health status and identify realistic targets for improvement.
Results
Key predictors of SOC variation
For this SOC application, feature selection reduced the initial set of 20 covariates to four dominant predictors: soil texture, Reference Soil Group (RSG), mean annual temperature (MAT), and precipitation (MAP). After removing redundant predictors using correlation screening (|r| > 0.75) and variance inflation factor (VIF) filtering (>5), the remaining predictors were evaluated for unique contribution to SOC prediction. This filtering removed strongly collinear covariates, including elevation, terrain-derived indices such as the digital elevation model, terrain ruggedness index, and wetness index, and hydroclimatic variables that overlapped with MAT and MAP (e.g., potential evapotranspiration). Predictors were then ranked using recursive feature elimination with a Random Forest (RF) model (1000 trees). Variable importance was estimated using the mean decrease in impurity, calculated as the total reduction in node mean squared error contributed by each predictor and averaged across all trees. During each recursive feature elimination iteration, predictors were ranked based on this importance measure, the least important variable was removed, and the model was refit. The smallest subset that preserved out-of-sample R² on the held-out test set was retained.
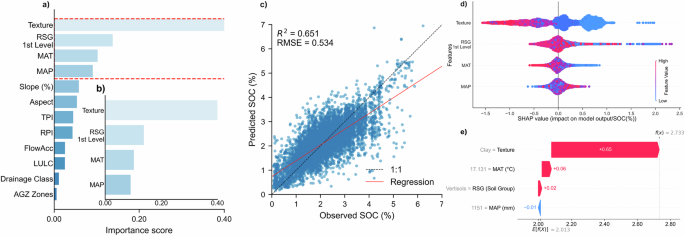
To support interpretability and practical use of the framework, we retained the four predictors that carried the greatest explanatory power. Although additional predictors produced slight increases in importance scores, they contributed minimal improvement in model performance (R2 < 0.01) and introduced complexity and multicollinearity. Because SHAPE-SSA is intended as a decision support tool for smallholder systems, we selected the smallest predictor set that maintained high predictive accuracy while remaining easy to interpret. The retained set also corresponds to the established regional-scale controls on SOC: mineralogical and surface-area effects on stabilization (texture, RSG), thermal regime governing turnover (MAT), and moisture supply (MAP), so the reduction has a mechanistic basis, not just a statistical one. Among them, texture emerged as the strongest driver (0.40 importance score), followed by RSG (0.14), MAT (0.10), and MAP (0.09) (Fig. 1a, b; Table S1). This parsimonious four-variable model explained 65.1% of SOC variance (R² = 0.651) with a root mean squared error (RMSE) of 0.534% SOC (Fig. 1c).
Shapley Additive Explanations (SHAP) independently validated both the strength and direction of the key predictors identified in the model. Among all covariates, texture was the most influential factor. In the SHAP summary plot (Fig. 1d), fine-textured classes generally showed positive SHAP values, indicating that they increased predicted SOC relative to the model baseline, whereas coarser-textured classes contributed less or shifted predictions downward. This pattern reflects the greater stabilization capacity of fine-textured soils through mechanisms such as aggregation and mineral-organic associations. Soil type, represented by first-level RSG, also contributed to SOC predictions, indicating that soil classification added information beyond texture alone. Some soil groups were associated with higher predicted SOC, whereas others were associated with lower or near-neutral contributions. These model-derived patterns are consistent with the understanding that finer-textured soils and some soil groups, such as Vertisols, Nitisols, and Andosols, are often associated with higher SOC, while coarser or more strongly weathered soils, such as Arenosols or Ferralsols, tend to show lower SOC levels. Climatic covariates (MAT and MAP) displayed nonlinear and bidirectional effects, indicating that temperature and moisture regulate SOC through threshold responses rather than simple linear gradients.
The local attribution analysis using the SHAP waterfall plot (Fig. 1e) further highlighted how individual predictors interact at the observation level. For a representative clay Vertisol sample, the predicted SOC was decomposed into the model’s baseline expectation and the additive Shapley contributions for each feature (f(x) = E[f(X)] + Σφj(x)). Texture contributed the largest increase in predicted SOC (+0.65), followed by MAT and soil group, while MAP showed a small negative offset. Together, these contributions explain why this clay Vertisol observation had higher predicted SOC than the model baseline under its observed soil and climate conditions.
Soil and climate controls on SOC capacity
Organizing soils into peer groups based on U.S. Department of Agriculture (USDA) soil texture classes and World Reference Base (WRB) RSG improved the interpretability and stability of SOC assessment (Table 1). Texture and RSG were included together because they capture different dimensions of inherent soil properties; The USDA soil texture class reflects particle size distribution and physical surface area for carbon protection, whereas WRB soil groups encode diagnostic features such as mineralogy, weathering status, horizon development, and parent material influence. These properties influence SOC stabilization independently of texture, and VIF analysis confirmed that the two predictors were not collinear (VIF < 5). Grouping soils into three texture classes (Fig. 2a), coarse (T1), medium (T2), and fine (T3), and four RSG categories (Fig. 2b; RSG2-RSG5) preserves key pedogenic differences—e.g., distinguishing sandy Arenosols from highly weathered Ferralsols despite both having relatively low SOC34. The grouping was guided by pedological interpretation and checked against observed SOC distributions and sample sizes, detail found in the Methods. Histosols (RSG1) were removed from the peer group to be evaluated separately due to their distinct organic carbon accumulation and decomposition processes. This grouping strategy allows SHAPE-SSA to estimate SOC relative to each soil’s inherent ecological potential rather than raw concentration values, while maintaining sufficient sample size for stable Bayesian inference and improving interpretive clarity.
Distinct and consistent gradients in SOC emerged for both texture and soil type13,34. Among texture classes, clay-rich soils (T3) held the highest SOC concentrations (2.7%), and sandy soils (T1) stored the least (1.3%). A similar pattern was observed across RSG categories, high-capacity soils such as Andosols and Nitisols (RSG2, 2.9%) accumulated more carbon than Arenosols and Gypsisols (RSG5, 1.0%), whereas RSG3 (2.1%) and RSG4 (1.7%) fell between these extremes.
Soil texture was paired with RSG to show the combined influence of particle-size distribution and mineralogical composition on SOC stabilization (Fig. 2c). The highest SOC (3.5%) was observed in fine-textured, nutrient-rich soils (T3-RSG2), while the lowest (<1.0%) occurred in coarse, nutrient-poor soils (T1-RSG5). Medium-textured groups, such as T2-RSG3 and T2-RSG4, showed intermediate values ranging from 2.1 to 2.7%. This peer grouping ensures that SHAPE-SSA accounts for the interactive structural and compositional controls that determine a soil’s carbon sequestration potential. The wider credible interval for T3 × RSG5 reflects the pedological rarity of fine-textured soils occurring within RSG5 groups, which are typically coarse-textured or weakly developed; this uncommon combination leads to greater posterior uncertainty.
Climatic gradients also shaped SOC distribution (Supplementary Fig. S1). SOC increased with precipitation (MAP; β = 0.0008, R² = 0.086, p < 0.001) but declined with temperature (MAT; β = −0.0805, R² = 0.074, p < 0.001), reflecting the balance between moisture-driven accumulation and temperature-accelerated decomposition.
Uncertainty-aware SOC distributions within soil-climate context
The Bayesian regression model achieved a strong predictive performance, achieving full convergence and high predictive accuracy as summarized in Tables S2 and S3. Among alternative specifications, the logit-Gaussian model outperformed the beta variant with lower leave-one-out information criterion (LOOIC 33,972 and 35,201, respectively). The model shows higher predictive density and robust Pareto-k diagnostics, all less than 0.7, and achieved a mean absolute error of 0.90% SOC.
Crucially, unlike fixed regression rules or expert-defined scoring curves such as those used in SMAF and CASH, this framework generates full posterior distributions rather than single-point estimates, which allows quantification of uncertainty and hierarchical representation of soil and climate effects. Conditional cumulative distribution functions (CDFs) are used to translate these posteriors into probabilistic soil health scores by expressing SOC values as quantiles within each peer group. For example, the SOC concentration of 2% in a T1-RSG2 soil under 18 °C and 1100 mm MAP receives a score of 0.67 (95% credible interval: 0.60–0.72), placing it above two-thirds of soils within its peer group.
Textural, mineralogical, and climatic constraints on SOC scores
SOC scoring curves derived from the Bayesian hierarchical model showed clear contrasts across soil textures, RSGs, and climatic gradients (Supplementary Figs. S2–S4). Expressed as CDFs, these scores quantify where a given SOC value ranks within its peer group. At a benchmark SOC of 2%, scores ranged from 0.09 in fine-textured RSG2 soils to 0.99 in coarse-textured RSG5 soils. This shows that identical SOC concentrations represent very different relative performance depending on the soil’s inherent capacity and climatic setting.
At the field scale, this scoring framework converts laboratory SOC measurements into percentile-based interpretations that are directly comparable within their ecological context. For example, a 2 % SOC value can be interpreted relative to the local MAT, MAP, texture, and RSG benchmarks to assess both current condition and the practical potential for further improvement. This makes SHAPE-SSA a practical interpretation tool, guiding management by showing whether additional carbon inputs are likely to yield measurable benefits or whether the soil is already near its inherent SOC capacity.
Variation across soil textures and reference soil groups
Under constant climatic conditions (MAT = 18 °C; MAP = 1100 mm), SOC scores showed systematic differences among textures and RSGs (Fig. 3). In these CDF plots, ecological potential is represented by the full posterior SOC distribution for each peer group, rather than a single numerical value; the y-axis limit of 1 simply corresponds to the top of the cumulative probability scale. In coarse-textured soils (T1), a 2% SOC corresponded to a score near 0.99 in RSG5, indicating that carbon rapidly approaches its upper potential within that peer group. Medium-textured soils (T2) showed intermediate responses with scores ranging from 0.15 in RSG2 to 0.87 in RSG5, while fine-textured soils (T3) had the lowest relative placement, from 0.09 (RSG2) to 0.50 (RSG5). Across all textures, scores increased stepwise from RSG2 to RSG5, reflecting the strong influence of inherent soil properties, particularly mineralogy and weathering status, on SOC potential.
Climate effects on SOC scoring
For a fixed SOC concentration, percentile scores increased with higher MAT because the model predicts lower baseline SOC under warmer climates, producing a downward shift in the peer group reference distribution. Accordingly, higher scores at higher MAT reflect relative position within a climate-adjusted baseline rather than an improvement in SOC. In fine-textured soils (Fig. 4), a 2% SOC value increased from 0.17 at 10 °C to 0.27 at 18 °C and 0.46 at 29 °C; medium-textured soils (Fig. 5) increased from 0.16 to 0.29 and 0.53; and coarse-textured soils (Fig. 6) increased from 0.54 to 0.83 over the same temperature range.
In contrast, precipitation showed a weaker influence on SOC scores. Under MAT = 18 °C, coarse-textured soils (T1-RSG2; Fig. 6) showed minimal variation, with scores declining slightly from 0.69 at 400 mm to 0.67 at 1100 mm. Medium-textured soils (T2-RSG2; Fig. 5) followed a similar trend, shifting marginally from 0.16 to 0.15, while fine-textured soils (T3-RSG2; Fig. 4) remained nearly constant. Across all textures, soils in RSG5 consistently exceeded 0.90 regardless of precipitation, indicating that precipitation had a limited effect once SOC approached the upper bounds of its peer group distribution.
Field-scale SOC opportunity gaps under contrasting management
Using the SHAPE-SSA framework, we computed SOC scores and opportunity gaps by comparing measured values against the 90th, 95th, and 99th percentiles of each peer group (Table 2). These percentiles represent empirical upper-tail reference points within each peer group rather than fixed biophysical limits, and the benchmark values are model-derived percentiles rather than separately sampled field observations. Soils can exceed them when management enhances SOC beyond the dominant regional expression of inherent capacity, consistent with the soil security distinction between inherent capability and current condition35. The 95th-percentile SOC gap quantifies the remaining carbon potential under current management conditions. Across 22 treatments from seven field sites, conservation-based systems consistently showed narrower gaps than conventional tillage. In Ethiopia’s Tigray region, for instance, cover cropping reached 3.52% SOC relative to a 6.01% peer group benchmark, leaving a 95th-percentile gap of 2.49% but placing the treatment in the upper quartile of its peer group. Conservation agriculture performed similarly well, approaching its attainable limit with a 0.43% gap between observed and benchmark values.
Discussion
From fixed thresholds to context-specific benchmarks
Soil health is inherently context-dependent, reflecting the functions and processes that soils perform within their environments13,36. What defines a healthy soil varies among ecosystems and management goals, but also among soils themselves, as differences in texture, mineralogy, and pedogenic development shape each soil’s inherent functional potential. Thus, soil health potential is dynamic in expression but ultimately governed by the inherent properties that arise from soil-forming factors. Although SOC is often desirable, inherent soil properties constrain the amount of organic carbon a soil can store. These same properties govern how nutrients are cycled, and how well structure and aggregation are maintained37. As a result, two soils managed under the same practice may function in strikingly different ways38,39. For instance, a Vertisol rich in swelling clays can stabilize far more organic carbon than a deeply weathered Oxisol, whose reactive mineral surfaces are largely exhausted40,41. Such genoform complexity challenges the logic of assessment frameworks built around uniform thresholds or single-number indices to represent soil health24,26. Although these frameworks offer structure and comparability, they implicitly assume that all soils respond similarly to management, a simplification that rarely holds in practice.
In tropical environments, where soil functions are shaped by intense weathering processes, such assumptions may underrepresent inherent soil constraints and overstate the influence of management practices. We need assessments that focus on indicators and outcomes most relevant to local soil functions. For example, fine-textured Andosols and Nitisols, which stabilize organic carbon through strong mineral-organic associations, require much higher organic-carbon levels to sustain aggregation and nutrient retention, whereas sandy Arenosols or calcareous Calcisols may appear adequate at low carbon contents simply because their capacity for stabilization is inherently limited42,43. Applying a single threshold to both systems can exaggerate performance in marginal soils while obscuring unrealized potential in those with greater resilience. This disconnect hides the opportunity gap, the difference between what a soil currently delivers and what it could achieve within its ecological limits and risks misdirecting both management and policy priorities13.
The SHAPE-SSA framework addresses these limitations by replacing fixed thresholds with peer group-specific CDFs estimated within a hierarchical Bayesian modeling structure that accounts for variability across soils, climates, and observational uncertainty. In its initial application, SOC is evaluated relative to soils of similar texture and soil type, adjusted for climatic covariates such as MAT and MAP. We interpreted it as a percentile score within its ecological baseline rather than as an absolute cut-off 44. In this framework, the peer group distribution represents the regional expression of inherent potential for soils sharing comparable pedogenic and climatic properties, providing an empirical reference envelope for interpretation. This approach parallels the pedogenon concept, where soils are grouped by shared pedogenic development to establish reference states for interpreting contemporary condition30,45. A key methodological advance lies in the explicit quantification of uncertainty. By generating full posterior distributions, the framework produces credible intervals for predictions, allowing for opportunity gaps. The gap is the difference between current and potential soil performance to be estimated rather than just assuming it exists46,47. This treatment of uncertainty is particularly valuable in tropical contexts where data are sparse, environmental variability is high, and management decisions carry livelihood risks.
The predictive structure in the framework does more than characterize uncertainty; it transforms it into actionable knowledge48. It uses spatial and pedogenic variability as analytical evidence to quantify how close or far a given soil is from its ecological potential. When posterior estimates place SOC near the ninety-fifth percentile of its peer group, the existing management practices on the farm, such as conservation tillage or residue retention, can be interpreted as operating near the system’s attainable limit. Where in cases wider gaps persist, as commonly observed under conventional management, the model draws attention to the need for more intensive restorative strategies. These may include organic amendments, diversified residue management, or agroforestry systems that rebuild carbon stocks and structural integrity over time26. In this sense, benchmarking within SHAPE-SSA serves not only as a diagnostic tool but also as a means of charting trajectories for improvement. A difference of roughly 2 to 3 percentage points between observed SOC and the upper percentile, for example, provides a realistic and measurable target for closing the performance gap through sustained organic-matter inputs.
While percentile benchmarks are useful for soil organic matter-related indicators such as SOC, their relevance is indicator-specific13,49. Different soil functions respond to indicators in different ways, and for many properties, utility-based transformations may be more appropriate than distributional percentiles50. For inorganic nutrients (phosphorus and potassium), values in the upper tail can exceed agronomic sufficiency by wide margins; targets for these properties should therefore be calibrated to yield responses and environmental safeguards rather than inferred from cumulative distributions alone34,51,52. In SHAPE-SSA, we treat CDFs as ecological baselines for SOC and pair them with credible intervals, using the latter to prioritize where interventions are warranted and where additional measurement would most improve decisions, an approach consistent with calls to align indicator interpretation with soil functions and management aims9,38. Like other reference group approaches, including pedogenons, these classes operate at the level of inherent soil capability rather than individual pedons, and the actionable signal comes from deviations from this peer group baseline rather than from the class boundaries themselves30,50. Peer groups, therefore, serve to define the appropriate reference baseline (capability) for benchmarking, not as the unit of management prescription. Intervention priorities are then identified at the field/observation scale using opportunity gaps and their credible intervals and can be further stratified by land use or management.
Pedogenic and mineralogical influence on SOC scoring
The SHAPE-SSA SOC scoring framework interprets how mineralogical and textural properties resolve the translation of a given carbon concentration into soil function position. These contrasts have direct implications for management strategies. Coarse-textured soils such as Arenosols (T1-RSG5), dominated by quartz sand with low clay content, reach high scores at relatively modest SOC levels. At 2% SOC, they already occupy the upper deciles of their distributions. This suggests that there is little room left for those soils to store more carbon because the binding sites (where carbon can be stabilized) are saturated. For these soils, the opportunity gap is narrow, and the rational strategy is maintenance: protecting existing stocks through residue retention and tillage rather than large investments in carbon build-up.
Climate constraints, management influence, and realistic SOC gains
Climate regulates SOC by shaping organic inputs, decomposition rates, and mineral-organic stabilization55,56. In tropical regions where seasonal variability is limited, MAT plays a dominant role in carbon turnover18. The scoring curves capture these dynamics by showing how fixed SOC concentrations represent very different percentiles under changing temperature and moisture regimes. Rising MAT improves SOC scores across most soil groups, not because soils improve, but because baseline SOC declines under accelerated microbial activity and carbon turnover39. For example, Ferralsols and Nitisols in medium-textured conditions show the scores rising from 0.40 at 10 °C to 0.70 at 29 °C for a 2% SOC. The gain reflects the decline of baseline SOC pools under heat stress. Fine-textured Andosols, which normally stabilize carbon within organo-mineral complexes, exhibit particularly steep percentile increases, indicating destabilization of previously protected pools57. In contrast, coarse Arenosols, already constrained by limited mineral surface area, show little response to warming, highlighting how soils with inherently low stabilization capacity may be less climatically sensitive but also less amenable to improvement.
These findings underline that SOC responses to climate are nonlinear and soil-specific. These trends indicate that as temperatures rise, SOC turnover intensifies even in structurally stable soils, leading to elevated scores that reflect functional decline rather than improvements in soil health. Under warming, fine soils demand input-intensive strategies such as diversified cover crops and organic amendments to counteract rapid carbon loss58. In wetter zones, erosion control and drainage become essential to preserve SOC persistence. Where soils exhibit narrow opportunity gaps and limited response, resources are better allocated to maintenance strategies that safeguard existing stocks. Given the high climatic variability across SSA, a climate-smart, soil-specific diagnostic approach is essential for sustainability planning59.
Translating peer group and climate into management-relevant scores
The three soil and climate contexts in Fig. 7 illustrate how the framework moves from peer group reference distributions to site-specific scoring and management direction. In each context (inherent condition), an observed SOC value is located on the peer group distribution frequency estimated for the matching texture-RSG-climate combination, and its position relative to the 90th, 95th, and 99th percentiles defines the opportunity gap. The highland Nitisol context (SHAPE-SSA peer group: T3-RSG3, 15 °C, 1800 mm MAP) sits in the lower portion of its distribution despite a moderate SOC value (i.e., 2%), because fine-textured highland soils carry a high stabilization ceiling (high inherent potential for carbon accumulation). The opportunity gap is wide, and the management signal is BUILD. Closing this gap requires practices that deliver sustained organic-matter inputs and conserve soil structure, allowing SOC to accumulate toward the inherent potential. The midland Cambisol context (SHAPE-SSA peer group: T2-RSG2, 20 °C, 1100 mm MAP) sits in the middle of its distribution, where the signal is BUILD/PROTECT: The SOC score is moderate relative to the regional potential, so the priority is to adopt practices that build SOC through sustained organic-matter inputs, cover cropping, and conservation tillage to move the soil toward its inherent ceiling. Where the SOC history indicates the soil began from a degraded state, the current management is already rebuilding SOC and should be retained, with higher-rate organic amendments added to accelerate progress toward the potential. The lowland Arenosol context (SHAPE-SSA peer group: T1-RSG5, 29 °C, 400 mm MAP) sits near the top of its distribution, because coarse soils have limited stabilization capacity; the gap is narrow, and the signal is MAINTAIN current management. Residue retention and minimum disturbance preserve existing SOC. Overall, this highlights that soil health interpretation is site and context-specific. For instance, the same SOC content can produce distinct scores requiring different management recommendations within the same region, which is the core advantage of percentile-based benchmarking over fixed concentration thresholds.
Herein, we developed and introduced a long-awaited soil health assessment framework for SSA60—i.e., SHAPE-SSA, using SOC to illustrate its application. The framework is intended as a dynamic and comprehensive multi-indicator soil health assessment system. Future implementation will include a minimum set of biological, chemical, and physical soil properties, with each indicator linked to the soil function and to practical management recommendations. Biological and biochemical properties can indicate organic matter turnover and nutrient cycling. Chemical and fertility properties inform nutrient availability, pollution, and fertilizer or amendment needs. Physical properties can describe rooting conditions, water movement, and erosion resistance. Each indicator will require its own reference distribution, uncertainty model, and interpretation rule before it can be linked to a decision support system. With a fully implemented framework across all three property domains, SHAPE-SSA will deliver the regionally calibrated, management-ready soil health diagnostic that SSA has long lacked.
Methods
Soil dataset and study region
We used data from the Ethiopia Soil Information System (EthioSIS), a national soil fertility mapping program initiated in 2012 and coordinated by the Ministry of Agriculture, with dataset accessibility described at the National Soil Information System portal (https://nsis.moa.gov.et/data/ethiosis/)61. The EthioSIS/NSIS portal reports approximately 70,000 georeferenced soil samples on a 2.5 km grid, analyzed between 2012 and 2017. SOC was determined by dry combustion on a CN analyzer and by Walkley-Black wet oxidation for the wet-chemistry subset and was predicted by mid-infrared diffuse-reflectance spectroscopy (Bruker TENSOR 27 with HTS-XT, 4000–600 cm−1) calibrated against the wet-chemistry subset using partial least squares regression (R2 = 0.91 for SOC). Measurement procedures for each soil property are summarized in Supplementary Table S4; full method metadata, sampling design, and laboratory quality assurance and quality control are maintained by the Ministry of Agriculture.
For this study, we used 28,000 georeferenced soil samples (0–20 cm depth) that met three inclusion criteria simultaneously: (i) a measured SOC value, (ii) complete values for all environmental covariates required for the SCORPAN-based modeling, and (iii) classification as a mineral soil excluding Histosols, Anthrosols, and Technosols, whose organic or anthropogenic characteristics fall outside the mineral-soil domain evaluated in this framework. These samples represent Ethiopia’s major agroecological zones and cropping systems, including teff, maize, wheat, sorghum, and barley. The dataset provides broad geographic coverage of Ethiopia’s agricultural landscapes, with denser sampling in mid- and high-altitude regions (1200–3500 m) dominated by rainfed production and lower representation in arid lowlands (<800 m) where pastoral systems prevail. The SHAPE-SSA analytical workflow and the spatial distribution of the 28,000 retained samples across Ethiopia are shown in Fig. 8a, b.
Environmental covariates and data preprocessing
To characterize the influence of soil and environmental covariates on SOC, we applied the SCORPAN framework62, organizing predictors into soil (S), climate (C), organisms/vegetation (O), relief (R), and spatial position (N) components (Initial covariates list and detailed data source shown in Table S5). Climate covariates included MAT (7.7–29.1 °C), MAP (398–1985 mm), and potential evapotranspiration, obtained from the WorldClim version 2 dataset and Climatologies at High Resolution for the Earth’s Land Surface Areas at 30-arcsecond (1 km) resolution, and FAO WaPOR at 0.1° (10 km) resolution63,64. Derived indices such as the wetness index and the de Martonne aridity index were calculated from MAP and potential evapotranspiration to represent combined water-energy constraints on SOC formation and persistence.
Soil properties were represented by the FAO World Reference Base, RSG, and texture classes obtained from Africa SoilGrids65, capturing differences in mineral composition and particle size distribution that influence carbon stabilization. Land cover and agroecological zones (O) were included to capture vegetation and spatial setting. Parent material and age (P, A) were not included in the present SOC scoring implementation, as parent material covariates were outside the scope of this SOC application. Continent-wide lithology datasets such as the Global Lithological Map66 are a candidate input for future SHAPE-SSA extensions, particularly where parent material is expected to improve micronutrient or weathering-sensitive indicator predictions. The analysis included 29 mineral soil RSG, excluding Histosols, Technosols, and Anthrosols. These groups were omitted because their organic or anthropogenic characteristics fall outside the range of mineral soils typically evaluated within the SHAPE framework, and their carbon dynamics cannot be directly compared with those of agricultural soils.
Topographic covariates were derived from the Shuttle Radar Topography Mission 30 m digital elevation models and obtained through the U.S. Geological Survey Earth Explorer portal, including elevation, slope, aspect, hillshade, flow accumulation, curvature, and related indices (topographic wetness, position, relief, and terrain ruggedness). These metrics describe landscape gradients that influence soil erosion, deposition, and drainage. Drainage and agroecological indicators provided a broader landscape context. Drainage class was extracted from Africa SoilGrids, while land-cover classification and agroecological zones delineated dominant physiographic and land-use regions. Together, these covariates cover the main pedogenic, climatic, and geomorphic drivers of SOC variability across the dataset landscapes, providing a coherent basis for SOC modeling.
Feature selection and model interpretation
We began with twenty candidate covariates representing soil, climate, organisms/vegetation, relief, and spatial position domains that plausibly influence SOC, following the SCORPAN digital soil mapping framework and established soil forming factor theory13,62. These domains were selected because SOC varies with edaphic properties, climate, vegetation, and topographic setting, which regulate organic matter inputs, decomposition, redistribution, and mineral protection. The selected predictors were therefore organized according to the SCORPAN components available for the study region:
$${{mathrm{SOC}}}_{i}={beta }_{0}+{beta }_{S}cdot {{{rm{S}}}}_{i}+{beta }_{C}cdot {{{rm{C}}}}_{i}+{beta }_{O}cdot {{{rm{O}}}}_{i}+{beta }_{R}cdot {{{rm{R}}}}_{i}+{e}_{i}$$
(1)
Here, β0 is the intercept, and βS–βR summarizes broad predictor groups capturing soil (S), representing mineralogical and textural controls; climate (C), capturing energy moisture constraints; organisms/vegetation (O) reflecting land cover influences; relief (R) describing topographic redistribution and landscape position. SOC is shaped by both inherent soil properties and environmental drivers, yet not all covariates provide unique or meaningful explanatory power.
To maintain parsimony and interpretability within the soil health framework, we used a sequential variable reduction procedure. Including too many predictors can introduce redundancy, increase model complexity, and limit interpretability within a soil health framework. We first applied correlation filtering to remove duplicate predictors (Supplementary Fig. S5), followed by VIF screening to control multicollinearity. We then used recursive feature elimination with an RF base model to identify the smallest subset of predictors that preserved out-of-sample accuracy. Recursive feature elimination is a wrapper-based method that iteratively ranks and removes the least important predictors67. Highly collinear covariates were removed using Pearson correlation (|r| > 0.75), and the remaining predictors were screened for multicollinearity using VIF > 5, where VIF is defined as:
$${{mathrm{VIF}}}_{i}=frac{1}{1-{R}_{i}^{2}}$$
(2)
with Ri2 the variance explained by regressing the i-th predictor on all others68. From this reduced set, recursive feature elimination with an RF base model (1000 trees) identified the most informative subset. Model performance for the RF-based feature selection stage was evaluated using a 70/30 train/test split, generated by random sampling without replacement. Random sampling at this sample size is effectively self-stratifying across the candidate predictors, so explicit stratification was not imposed. The approximate standard error on R2 for a test set of 8400 observations at R2 = 0.65 is on the order of 0.006, well below the reporting precision used in the main text. All preprocessing steps, including correlation filtering, VIF screening (Supplementary Table S6), recursive feature elimination, and RF fitting/tuning, were performed only on the 70% training set; the 30% held out test set was used for out-of-sample evaluation, and the coefficient of determination was computed using the standard formulation:
$${R}^{2}=1-frac{{sum }_{i=1}^{n}{left({y}_{i}-hat{{y}_{i}}right)}^{2}}{{sum }_{i=1}^{n}{left({y}_{i}-bar{y}right)}^{2}}$$
(3)
where yi and ({hat{y}}_{i}) are observed and test-set predictions (expressed on the back-transformed SOC % scale). RMSE was computed as:
$${{rm{RMSE}}}=sqrt{frac{1}{n}{sum }_{i=1}^{n}{left({y}_{i}-hat{{y}_{i}}right)}^{2}}$$
(4)
The optimized RF model achieved an out-of-sample R2 of 0.651 and RMSE of 0.534% SOC, indicating that a compact predictor set adequately captured the dominantchical Bayesian scoring model was evaluated separately using posterior predictive checks, convergence diagnostics, Pareto-smoothed importance sampling leave-one-out cross-validation, and Pareto-k diagnostics
To evaluate model interpretability and quantify the marginal contribution of each predictor, we applied SHAP to the held-out test data. SHAP decomposes model predictions into additive contributions from individual predictors, enabling both global importance ranking and local interpretability69.
$${phi }_{i}={sum }_{Ssubseteq N,inotin S}frac{left|Sright|!left(left|Nright|-left|Sright|-1right)!}{left|Nright|!}left[fleft(Scup iright)-fleft(Sright)right]$$
(5)
where, N is the full set of predictors, i is the specific predictor being evaluated, and f(S) is the model’s prediction when using the subset S. The RF-based SHAP explainer was applied to predictions from the model trained on the calibration set and evaluated on the held-out test set, providing both global importance rankings and local attributions. Nonlinear responses were examined using dependence and violin plots. Predictor robustness was tested by permuting each variable 500 times to generate a null distribution of SHAP values, and significance was determined as the fraction of permuted means exceeding observed contributions. RF importance was used for feature selection, whereas SHAP was used for interpretation because it provides consistent, directionally meaningful contributions and local explanations not available from RF importance alone. Full correlation filtering, VIF analysis, and SHAP implementation details are presented in Supplementary Note S1.
Peer group definition
Soil peer groups were defined before fitting the hierarchical Bayesian model. Following the SHAPE13 peer group approach, soils were compared within groups that shared similar inherent edaphic context, while climate covariates adjusted the conditional SOC distribution. For SHAPE-SSA, peer groups were defined from two categorical inherent soil attributes: USDA soil texture class and WRB RSG. Texture classes were aggregated into three broad classes: coarse-textured soils (T1: sand, loamy sand, sandy loam), medium-textured soils (T2: loam, silt loam, silt, sandy clay loam, clay loam, silty clay loam), and fine-textured soils (T3: sandy clay, silty clay, clay). WRB RSGs were grouped into four classes (RSG2-RSG5) based on shared pedogenic characteristics relevant to SOC stabilization, including mineralogy, weathering status, horizon development, drainage influence, and expected carbon-retention capacity.
The grouping was guided by pedological interpretation and checked against observed SOC distributions and sample sizes within Texture and RSG combinations. This step was used to avoid sparse or unstable groups while preserving interpretable differences in inherent SOC capacity. MAT and MAP were not discretized into peer group classes; they were retained as continuous climatic covariates in the Bayesian model. Histosols were excluded from the mineral-soil peer groups because their organic carbon accumulation and decomposition processes differ from those of mineral soils. VIF analysis confirmed that texture and RSG were not collinear (all VIF values < 5), supporting their joint inclusion in the model. Using both variables, therefore, preserved key inherent differences among soils while maintaining sufficient sample size for stable hierarchical estimation.
Hierarchical Bayesian SOC model
The four predictors retained after feature selection: texture, RSG, MAT, and MAP, were used in a hierarchical Bayesian regression to predict SOC. Texture and RSG were included as categorical fixed effects, and also defined Texture × RSG peer groups for group-level random intercepts. MAT and MAP were included as continuous climate covariates. This model structure allowed each peer group to have a distinct baseline SOC level while sharing information across groups through partial pooling. To capture residual pedogenic heterogeneity, texture and RSG peer groups were assigned group-level random intercepts, allowing each group to express a distinct baseline SOC potential while sharing common climatic slopes.
Fixed effect coefficients represent population-level contrasts, whereas the random intercepts absorb group-specific deviations not explained by the fixed effects. In this parameterization, peer group intercepts are centered as deviations from the fixed effect structure, so that they represent residual pedogenic variability rather than duplicating marginal effects70. Continuous climatic covariates (MAT and MAP) were modeled with shared slopes to reflect broad temperature-moisture constraints on SOC. This hierarchical structure propagates uncertainty across levels, stabilizes the inference in sparse peer groups, and reflects how soil-specific properties mediate climate effects on SOC71.
Texture and RSG therefore operate at two hierarchical levels: (i) as fixed effect predictors describing structural and mineralogical contrasts, and (ii) as grouping factors representing unobserved pedogenic variability. This structure is consistent with established practice in hierarchical environmental modeling and is the most parsimonious way to represent differences in inherent SOC potential across soil classes72. Ecological potential is derived from the peer group posterior predictive distribution, where the model generates a conditional SOC CDF for each texture and RSG group at the observed MAT and MAP, and percentiles of this CDF define the empirical high-end baseline used for SHAPE-SSA scoring. SOC observations were logit-transformed to constrain predictions within the 0–1 range and back-transformed to percentages using the inverse logit function, ({{{rm{logit}}}}^{-1}left(xright)=frac{1}{1+{e}^{-x}}). The model for each observation i can be expressed as
$${{mathrm{SOC}}}_{i}{{mathscr{sim }}}{{mathscr{N}}}left({{{rm{beta }}}}_{0}+{sum }_{j=1}^{P}{{{rm{beta }}}}_{j}{X}_{{ij}}+{{{rm{alpha }}}}_{gleft[iright]},{{{rm{sigma }}}}^{2}right),{{{rm{alpha }}}}_{g}{{mathscr{sim }}}{{mathscr{N}}}left(0,{{{rm{sigma }}}}_{{{rm{alpha }}}}^{2}right)$$
(6)
where, SOCi is the logit-transformed value for observation i. The fixed-effect coefficients (β0, βj) represent the overall SOC baseline and the population-level effects of soil and climate covariates across all sites. The group-level term (αg) describes deviations specific to each soil peer group, reflecting how mineralogical and pedogenic differences modify SOC potential beyond the general climatic controls. The residual variance (σ2) quantifies unexplained variability after accounting for both fixed and random effects, whereas the group-level variance (({sigma }_{alpha }^{2})) quantifies how much SOC variability occurs from inherent differences among soil types.
Weakly informative priors were used to constrain parameter estimates within plausible bounds, while maintaining flexibility. These priors help stabilize inference by providing moderate regularization without imposing strong directional assumptions. Given the large dataset, such priors were sufficient to ensure parameter identifiability without requiring additional hierarchical hyperpriors. Fixed effect coefficients were assigned Normal (0, 1) priors to induce moderate shrinkage, while group-level and residual variances (σα, σ) were assigned half-Cauchy (0, 5) priors, which encourage positive values but limit unrealistically large variances.
$${{{rm{beta }}}}_{j}{{mathscr{sim }}}{{mathscr{N}}}left(0,1right);{sigma }_{alpha },sigma sim {{rm{Half}}}-{{rm{Cauchy}}}left(0,5right)$$
(7)
Together, the likelihood and priors define the full joint posterior distribution, from which the model estimates both population-level effects and peer group-specific random intercepts. This structure allows each texture and RSG peer group to express a unique baseline SOC potential while sharing climatic responses.
$$ [pleft(beta ,alpha ,sigma ,|,{mathrm{SOC}}right)propto {prod }_{i}{{mathscr{N}}}!left({{mathrm{SOC}}}_{i},|,{beta }_{0}+{sum }_{j}{beta }_{j}{X}_{{ij}}+{alpha }_{gleft[iright]},{sigma }^{2}right) \ times {{mathscr{N}}}left(beta ,|,0,1right)times {mathrm{Half}}-{mathrm{Cauchy}}left({sigma }_{alpha },|,0,5right)times {mathrm{Half}}-{mathrm{Cauchy}}left(sigma ,|,0,5right)]$$
(8)
Models were implemented in Stan using Hamiltonian Monte Carlo sampling (four chains, 4000 iterations, 2000 burn-in). We evaluated two likelihood formulations, beta likelihood (SOC rescaled to the unit interval) and a logit-Gaussian model, to ensure robust handling of bounded and skewed data. The logit-Gaussian model achieved superior predictive performance (Δlooic = −1229.3) and was retained for scoring.
Posterior-derived percentile scoring of soil organic carbon
Posterior predictions from the hierarchical model were converted into CDFs to express SOC as a percentile within its expected soil-climate dataset. This converts absolute observation into probabilistic scores that indicate whether soil is performing near, below, or above its ecological potential. The percentile score for observation i is computed on the logit scale as,
$${F}_{{Y}_{i}}left({Y}_{i}right)=Phi left(frac{{Y}_{i}-left({beta }_{0}+{sum }_{j=1}^{P}{beta }_{j}{X}_{{ij}}+{alpha }_{gleft[iright]}right)}{sigma }right)$$
(9)
where FYi(Yi) is the percentile rank of the observed SOC within its peer group; Φ((cdot)) is the standard normal CDF, Yi is observed SOC, β0 the global intercept, βj the fixed-effect coefficients (for MAT, MAP), Xij is predictor values, αg[i] is the random intercept for peer group g, and σ the residual standard deviation. Ecological potential is derived from the same conditional posterior predictive distribution, where upper‑tail percentiles provide empirical high‑end benchmarks representing the inherent SOC potential under that peer group and climatic context. Each percentile (0–1) quantifies the probability that a soil observed SOC falls below its expected value given its peer group and climatic conditions. Higher percentiles identify soils whose SOC exceeds the peer group benchmark, consistent with management effects or land use history, whereas lower percentiles indicate soils depleted relative to their inherent potentials. By interpreting SOC within its probabilistic reference distribution, this scoring framework separates inherent soil potential from management-driven changes, providing a regionally grounded and uncertainty-aware measure of soil health. Posterior percentiles were summarized as medians with 95% credible intervals, giving interpretable, comparable benchmarks for soil health assessment.
Model diagnostics and validation
Model convergence and predictive reliability were verified using standard Bayesian diagnostics, including the Gelman-Rubin statistic (R̂ = 1.0), posterior predictive checks (Bayesian p = 0.5), and stable Pareto-k values across observations. These diagnostics confirmed robust model fit and reliable CDF-based scoring across soil-climate groups. Detailed diagnostic equations, leave-one-out cross-validation metrics, and additional validation summary are provided in Supplementary Note S2 and Tables S2, S3 and S7.
Data availability
The primary soil observations were obtained from EthioSISa.gov.et/data/ethiosis/). These data are controlled by EthioSIS/NSIS and are available to researchers upon request through the NSIS/EthioSIS access procedures; the authors do not have permission to publicly redistribute the underlying records
Code availability
Custom R and Python scripts implementing data preprocessing, feature selection, SHAP-based interpretability analysis, and hierarchical Bayesian modeling are available from the corresponding author upon request.
References
-
Georgiou, K. et al. Global stocks and capacity of mineral-associated soil organic carbon. Nat. Commun.13, 3797 (2022).
-
Lal, R. Soil carbon sequestration impacts on global climate change and food security. Science304, 1623–1627 (2004).
-
FAO. The State of the World’s Land and Water Re2021). (FAO, 2021)
-
van Dijk, M., Morley, T., Rau, M. L. & Saghai, Y. A meta-analysis of projected global food demand and population at risk of hunger for the period 2010–2050. Nat. Food2, 494–501 (2021).
-
Even, R. J. & Francesca Cotrufo, M. The ability of soils to aggregate, more than the state of aggregation, promotes protected soil organic matter formation. Geoderma442, 116760 (2024).
-
Amundson, R. et al. Soil and human security in the 21st century. Science348, 1261071 (2015).
-
Mohkam-Singh & Nunes, M. R. A 30-Year overview of soil fertility, soil quality, and soil health research in Florida. Ecol. Indic.176, 113660 (2025).
-
Doran, J. W. Soil health and global sustainability: translating science into practice. Agric. Ecosyst. Environ.88, 119–127 (2002).
-
Lehmann, J., Bossio, D. A., Kögel-Knabner, I. & Rillig, M. C. The concept and future prospects of soil health. Nat. Rev. Earth Environ.1, 544–553 (2020).
-
USDA/NRCS. Soil Health | Natural Reon-basics/soil/soil-health (2026)
-
Kihara, J., Bolo, P., Kinyua, M., Nyawira, S. S. & Sommer, R. Soil health and ecosystem services: lessons from sub-Saharan Africa (SSA). Geoderma370, 114342 (2020).
-
Steinberger, Y. et al. A sensitive soil biological indicator to changes in land-use in regions with Mediterranean climate. Sci. Rep.12, 22216 (2022).
-
Nunes, M. R. et al. The soil health assessment protocol and evaluation applied to soil organic carbon. Soil Sci. Soc. Am. J.85, 1196–1213 (2021).
-
Karlen, D. L., Veum, K. S., Sudduth, K. A., Obrycki, J. F. & Nunes, M. R. Soil health assessment: past accomplishments, current activities, and future opportunities. Soil Tillage Res.195, 104365 (2019).
-
Bagnall, D. K. et al. A minimum suite of soil health indicators for North American agriculture. Soil Secur.10, 100084 (2023).
-
Alimagham, S. et al. Climate change impact and adaptation of rainfed cereal crops in sub-Saharan Africa. Eur. J. Agron.155, 127137 (2024).
-
van Ittersum, M. K. et al. Prospects for cereal self-sufficiency in sub-Saharan Africa. Proc. Natl. Acad. Sci. USA. 122, e2423669122 (2025).
-
Sanchez, P. A. Properties and Management of Soils in the Tropics (Cambridge University Press, 2019).
-
Gashu, D. et al. The nutritional quality of cereals varies geospatially in Ethiopia and Malawi. Nature594, 71–76 (2021).
-
Belay, A. et al. Zinc deficiency is highly prevalent and spatially dependent over short distances in Ethiopia. Sci. Rep.11, 6510 (2021).
-
Swan, T., McBratney, A. & Field, D. Linkages between soil security and one health: implications for the 2030 Sustainable Development Goals. Front. Public Health12, 1447663 (2024).
-
Cahyana, D., Karolinoerita, V., Manurung, E. D. & Wulanningtyas, H. S. Bridging the conceptual gap between soil quality and soil health for one health. Soil Secur.22, 100219 (2026).
-
Guo, M. Soil health assessment and management: recent development in science and practices. Soil Syst.5, 61 (2021).
-
Andrews, S. S., Karlen, D. L. & Cambardella, C. A. The Soil Management Assessment Framework. Soil Sci. Soc. Am. J.68, 1945–1962 (2004).
-
Moebius-Clune, B. N. Comprehensive Assessment of Soil Health: The Cornell Framework Manual (Cornell University, 2016).
-
Nunes, M. R. et al. SHAPEv1.0 Scoring curves and peer group benchmarks for dynamic soil health indicators. Soil Sci. Soc. Am. J.88, 858–875 (2024).
-
Amorim, H. C. S., Ashworth, A. J., Drescher, G. L., Singh, M. & Nunes, M. R. Transferability of Soil Management Assessment Framework indices to detect best soil management strategies in tropical agroecosystems. Agric. Environ. Lett.10, e70013 (2025).
-
Matus, F., Rumpel, C., Neculman, R., Panichini, M. & Mora, M. L. Soil carbon storage and stabilisation in andic soils: a review. CATENA120, 102–110 (2014).
-
Fine, A. K., van Es, H. M. & Schindelbeck, R. R. Statistics, scoring functions, and regional analysis of a comprehensive soil health database. Soil Sci. Soc. Am. J.81, 589–601 (2017).
-
Román Dobarco, M., McBratney, A., Minasny, B. & Malone, B. A framework to assess changes in soil condition and capability over large areas. Soil Secur.4, 100011 (2021).
-
Román Dobarco, M., Padarian Campusano, J., McBratney, A. B., Malone, B. & Minasny, B. Genosoil and phenosoil mapping in continental Australia is essential for soil security. Soil Secur.13, 100108 (2023).
-
Amgain, N. R., Xu, N., Rabbany, A., Fan, Y. & Bhadha, J. H. Developing soil health scoring indices based on a comprehensive database under different land management practices in Florida. Agrosyst. Geosci. Environ.5, e20304 (2022).
-
Hughes, H. M. et al. Towards a farmer-feasible soil health assessment that is globally applicable. J. Environ. Manag.345, 118582 (2023).
-
Franzluebbers, A. J. Cumulative frequency distributions of soil health properties under grasslands and woodlands across North Carolina. Soil Sci. Soc. Am. J.89, e70142 (2025).
-
McBratney, A., Field, D. J. & Koch, A. The dimensions of soil security. Geoderma213, 203–213 (2014).
-
Matson, A. et al. Four approaches to setting soil health targets and thresholds in agricultural soils. J. Environ. Manag.371, 123141 (2024).
-
Lichtenberg, E. Thinking about soil health: a conceptual framework. Soil Secur.14, 100130 (2024).
-
Bünemann, E. K. et al. Soil quality—a critical review. Soil Biol. Biochem.120, 105–125 (2018).
-
Poeplau, C. & Don, A. A simple soil organic carbon level metric beyond the organic carbon-to-clay ratio. Soil Use Manag.39, 1057–1067 (2023).
-
Chevallier, T. et al. Short-range-order minerals as powerful factors explaining deep soil organic carbon stock distribution: the case of a coffee agroforestry plantation on Andosols in Costa Rica. Soil5, 315–332 (2019).
-
Lal, R. Restoring soil quality to mitigate soil degradation. Sustainability7, 5875–5895 (2015).
-
Kirsten, M. et al. Iron oxides and aluminous clays selectively control soil carbon storage and stability in the humid tropics. Sci. Rep.11, 5076 (2021).
-
Bruun, T. B., Elberling, B. & Christensen, B. T. Lability of soil organic carbon in tropical soils with different clay minerals. Soil Biol. Biochem.42, 888–895 (2010).
-
Menichetti, L., Kätterer, T. & Bolinder, M. A. Bayesian calibration of the ICBM/3 soil organic carbon model constrained by data from long-term experiments and uncertainties of C inputs. Carbon Manag.15, 2304749 (2024).
-
Francos, N. et al. The global pedogenon map: Combining and spatialising the factors of soil formation. Geoderma460, 117462 (2025).
-
Liu, S., Wang, Y., Yang, Y. & Li, Z. A Bayesian network simulates the responses of soil organic carbon to environmental factors at a catchment scale. CATENA233, 107493 (2023).
-
Xie, H. W., Romero-Olivares, A. L., Guindani, M. & Allison, S. D. A Bayesian approach to evaluation of soil biogeochemical models. Biogeosciences17, 4043–4057 (2020).
-
Britten, G. L. et al. Evaluating the benefits of Bayesian hierarchical methods for analyzing heterogeneous environmental datasets: a case study of marine organic carbon fluxes. Front. Environ. Sci. 9, 491636 (2021).
-
Feeney, C. J. et al. Benchmarking soil organic carbon (SOC) concentration provides more robust soil health assessment than the SOC/clay ratio at European scale. Sci. Total Environ.951, 175642 (2024).
-
Ng, W. et al. Estimating surrogates, utility graphs and indicator sets for soil capacity and security assessments using legacy data. Soil Res.62, SR23138 (2024).
-
Slaton, N. A. et al. Models and sufficiency interpretation for estimating critical soil test values for the Fertilizer Recommendation Support Tool. Soil Sci. Soc. Am. J.88, 1419–1437 (2024).
-
Culman, S. et al. Probability of crop response to phosphorus and potassium fertilizer: Lessons from 45 years of Ohio trials. Soil Sci. Soc. Am. J.87, 1207–1220 (2023).
-
Basile-Doelsch, I. et al. Mineral control of carbon pools in a volcanic soil horizon. Geoderma137, 477–489 (2007).
-
Guo, Z., Zhang, Z., Zhou, H., Wang, D. & Peng, X. The effect of 34-year continuous fertilization on the SOC physical fractions and its chemical composition in a Vertisol. Sci. Rep.9, 2505 (2019).
-
Burke, I. C. et al. Texture, climate, and cultivation effects on soil organic matter content in U.S. grassland soils. Soil Sci. Soc. Am. J.53, 800–805 (1989).
-
Zhang, Y. et al. The response of soil organic carbon to climate and soil texture in China. Front. Earth Sci.16, 835–845 (2022).
-
Georgiou, K. et al. Emergent temperature sensitivity of soil organic carbon driven by mineral associations. Nat. Geosci.17, 205–212 (2024).
-
Chang, N. et al. Soil organic carbon prediction based on different combinations of hyperspectral feature selection and regression algorithms. Agronomy13, 1806 (2023).
-
Xiong, X. et al. Interaction effects of climate and land use/land cover change on soil organic carbon sequestration. Sci. Total Environ.493, 974–982 (2014).
-
Ologunde, O. H. & Nunes, M. R. Redefining soil health and food security through tropical conservation agriculture. Commun. Sustain.1, 82 (2026).
-
Ministry of Agriculture of Ethiopia. EthioSIS Soil Dataset. https://nsis.moa.gov.et/data/ethiosis.
-
McBratney, A. B., Mendonça Santos, M. L. & Minasny, B. On digital soil mapping. Geoderma117, 3–52 (2003).
-
Fick, S. E. & Hijmans, R. J. WorldClim 2: new 1-km spatial resolution climate surfaces for global land areas. Int. J. Climatol.37, 4302–4315 (2017).
-
Karger, D. N. et al. Climatologies at high resolution for the Earth’s land surface areas. Sci. Data4, 170122 (2017).
-
Hengl, T. et al. SoilGrids250m: global gridded soil information based on machine learning. PLoS ONE12, e0169748 (2017).
-
Hartmann, J. & Moosdorf, N. The new global lithological map database GLiM: A representation of rock properties atthe Earth surface. Geochem. Geophys. Geosyst.13, Q12004 (2012).
-
Liu, W. & Wang, J. Recursive elimination current algorithms and a distributed computing scheme to accelerate wrapper feature selection. Inf. Sci.589, 636–654 (2022).
-
O’brien, R. M. A caution regarding rules of thumb for variance inflation factors. Qual. Quant.41, 673–690 (2007).
-
Lundberg, S. M. & Lee, S.-I. A unified approach to interpreting model predictions. In Proc. Advances in Neural Information Processing Systems Vol. 30 (Curran Associates, Inc., 2017).
-
Gelman, A. & Hill, J. Data Analysis Using Regression and Multilevel/Hierarchical Models (Cambridge University Press, 2021).
-
van de Schoot, R. et al. Bayesian statistics and modelling. Nat. Rev. Methods Primer1, 1–26 (2021).
-
Li, J. et al. Hierarchical drivers shaping the global patterns of soil organic carbon. Earth’s Future13, e2025EF006168 (2025).
-
European Commission. Joint Research Centre. Soil Atlas of Africa. (Publications Office, LU, 2013).
-
Demissie, S. et al. Cover crops improve soil condition and barley yield in a subtropical highland agroecosystem. Nutr. Cycl. Agroecosyst.129, 257–275 (2024).
-
Bekele, B., Habtemariam, T. & Gemi, Y. Evaluation of conservation tillage methods for soil moisture conservation and maize grain yield in low moisture areas of SNNPR, Ethiopia. Water Conserv. Sci. Eng.7, 119–130 (2022).
-
Araya, T. et al. Influence of 9 years of permanent raised beds and contour furrowing on soil health in conservation agriculture based systems in Tigray region, Ethiopia. Land Degrad. Dev.32, 1525–1539 (2021).
-
Adugna, O., Quarishi, S. & Bedadi, B. Effects of water erosion on soil chemical loss under different tillage and cropping system in clay loam soil at Assosa, Ethiopia. J. Biosci. Agric. Res.14, 1222–1230 (2017).
-
Minase, N. A., Masafu, M., Geda, A. E. & Wolde, A. T. Impact of tillage type and soil texture to soil organic carbon storage: the case of Ethiopian smallholder farms. Afr. J. Agric. Res.11, 1126–1133 (2016).
-
Araya, T. et al. Medium-term effects of conservation agriculture based cropping systems for sustainable soil and water management and crop productivity in the Ethiopian highlands. Field Crops Res.132, 53–62 (2012).
Acknowledgements
The authors thank the Department of Soil, Water, and Ecosystem Sciences at the University of Florida for academic, logistical support, and funding. The authors also gratefully acknowledge the Ministry of Agriculture for providing access to the Ethiopia Soil Information System national soil database used in this study. Moreover, the authors appreciate the contributions of collaborators from CIMMYT for their technical input and coordination during data integration and interpretation.
Funding
This research was primarily supported by both the University of Florida and the CGIAR Sustainable Farming Science Program, with contributions from the CGIAR Trust Fund and through bilateral funding agreements, administered by the International Maize and Wheat Improvement Center, CIMMYT (project PO354313 to Marcio Nunes at the University of Florida). The research was also supported by the USDA National Institute of Food and Agriculture project 7004188 through capacity grant FLA-SWS-006289 to Marcio Nunes. This work also used the HiPerGator high-performance computing facility and was supported by the University of Florida Research Computing through the Library HiPerGator Sponsorship Program.
Authors and Affiliations
Contributions
M.K.B. and M.R.N. conceived the SHAPE-SSA framework, designed the study, and developed the analytical approach. M.K.B. performed the formal data analysis and modeling and prepared the first draft of the manuscript, with input from M.R.N., C.L.M., T.S.S., and G.K.B. M.R.N. supervised the overall methodological development and interpretation and secured funding for the work. All authors contributed to data interpretation and manuscript review. C.L.M., M-.S., N.B.D., E.E., G.K.B., and T.S.S. provided domain expertise, data resources, and critical feedback throughout the research and writing process. All authors read and approved the final version of the manuscript.
Ethics declarations
Competing interests
The authors declare no competing interests.
Peer review
Peer review information
Communications Earth and Environment thanks Brendan P. Malone and the other, anonymous, reviewer(s) for their contribution to the peer review of this work. Primary Handling Editors: Somaparna Ghosh A peer review file is available.
Additional information
Publisher’s note Springer Nature remains neutral with regard to jurisdictional claims in published maps and institutional affiliations.
Supplementary information
Rights and permissions
Open Access This article is licensed under a Creative Commons Attribution-NonCommercial-NoDerivatives 4.0 International License, which permits any non-commercial use, sharing, distribution and reproduction in any medium or format, as long as you give appropriate credit to the original author(s) and the source, provide a link to the Creative Commons licence, and indicate if you modified the licensed material. You do not have permission under this licence to share adapted material derived from this article or parts of it. The images or other third party material in this article are included in the article’s Creative Commons licence, unless indicated otherwise in a credit line to the material. If material is not included in the article’s Creative Commons licence and your intended use is not permitted by statutory regulation or exceeds the permitted use, you will need to obtain permission directly from the copyright holder. To view a copy of this licence, visit http://creativecommons.org/licenses/by-nc-nd/4.0/.
About this article
Cite this article
Biru, M.K., Nunes, M.R., Mohkam-Singh et al. A region-specific soil health assessment protocol and evaluation for Sub-Saharan Africa.
Commun Earth Environ7, 670 (2026). https://doi.org/10.1038/s43247-026-03727-1
-
Version of record:18 August 2026
-
DOI
:https://doi.org/10.1038/s43247-026-03727-1

